See what actually happened.
Every event tells the full story. Understand what went wrong with the context you need—without digging through endless console logs.
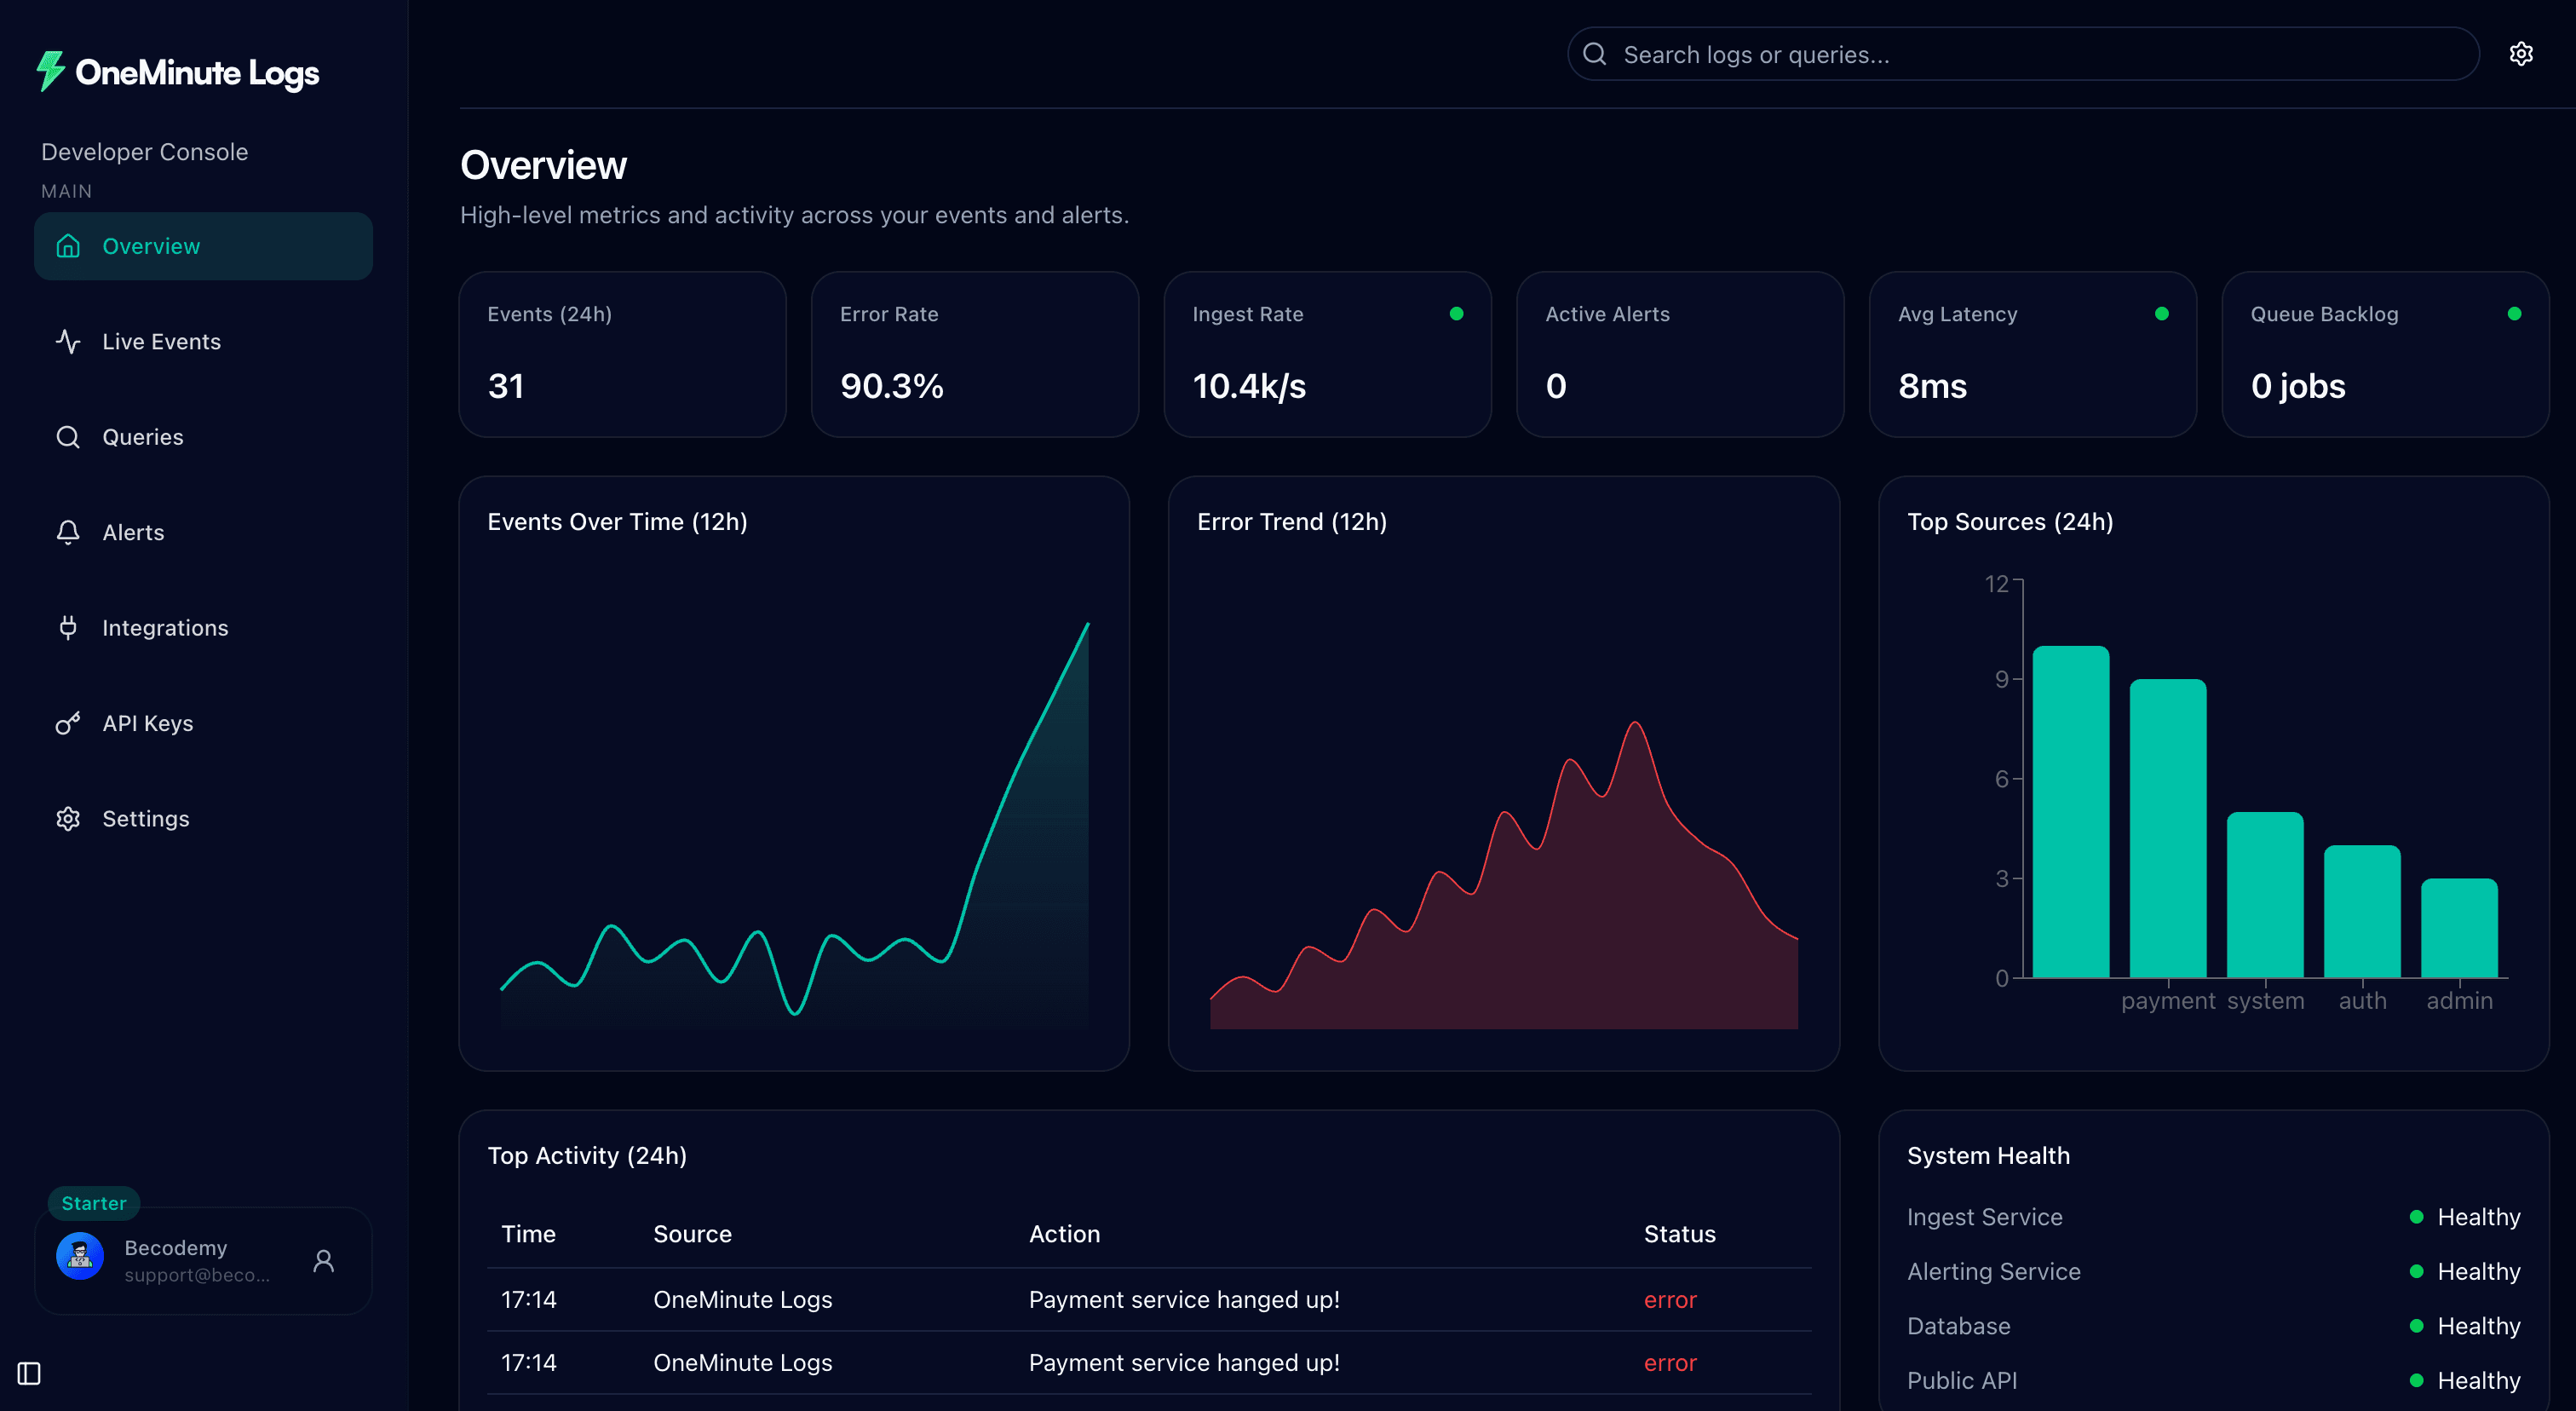
Monitor your application in real time with live events, instant alerts, and lightning-fast search — all in under a minute.
Loved by developers from the world’s leading organizations


This is my story.
A while ago, one of my SaaS products suddenly stopped working. Users couldn’t use important features, and I had no idea what had happened. I spent hours asking AI, restarting services, reading server logs, and trying to piece together what had gone wrong while real users were waiting.
Eventually, after a few hours, I fixed the problem. But one question stayed with me.
What if I had known exactly what was happening inside my application?
That single question became the idea behind OneMinute Logs.
I didn’t want another observability platform that required days of setup or a stack of infrastructure to maintain. I wanted something any developer—or even an AI coding assistant—could set up in under a minute. A platform that quietly watches your application after you deploy, alert you the moment something breaks, and gives you the answers you need before small issues become bigger ones.
That’s why OneMinute Logs exists. So you’ll always know what’s happening inside your application.
Built for developers who want answers, not another system to manage.
Every event tells the full story. Understand what went wrong with the context you need—without digging through endless console logs.
Search by status, endpoint, user, or any custom field. Go from “Something broke” to the exact event in seconds.
Stream live events directly inside your own dashboard. Stay connected to your application without switching tools.
Set conditions for payment failures, critical errors, queue problems, or anything important. OneMinute Logs alerts you as soon as matching events appear.
Add a small SDK, set the events you care about, and let OneMinute Logs watch production.
Add it yourself, or ask your AI coding assistant to do it.
Use your API key and choose the environment to watch.
Track the errors and events you want to know about.
That's it. No config, no servers, no YAML.
1npm install @oneminutelogs/next2# or3npm install @oneminutelogs/expressI asked Cursor to add the SDK and had production alerts working a few minutes later.
A payment webhook failed after launch. The alert showed me the exact error before anyone opened a ticket.
I did not need to learn observability. I needed to know what broke, and that is exactly what I got.
We show live logs inside our admin dashboard now. Support can see what happened without asking me to SSH anywhere.
I asked Cursor to add the SDK and had production alerts working a few minutes later.
A payment webhook failed after launch. The alert showed me the exact error before anyone opened a ticket.
I did not need to learn observability. I needed to know what broke, and that is exactly what I got.
We show live logs inside our admin dashboard now. Support can see what happened without asking me to SSH anywhere.
No Grafana, no YAML, no infra project. Just the production context I need after a deploy.
When a customer reports a bug, I can search the event and find the failing request in seconds.
The limits are easy to understand. We upgraded when retention and alerts started to matter more.
I stopped pretending I wanted to run ELK for a two-person SaaS. This is the right amount of logging.
No Grafana, no YAML, no infra project. Just the production context I need after a deploy.
When a customer reports a bug, I can search the event and find the failing request in seconds.
The limits are easy to understand. We upgraded when retention and alerts started to matter more.
I stopped pretending I wanted to run ELK for a two-person SaaS. This is the right amount of logging.
Start free. Upgrade only when your application needs more history, alerts, and scale.
Deploy without wondering what broke while you were away.